

-
1848 Views
The practical difference between ROAS and marketing ROI matters for how you use them.
UKCV
10 marketing KPIs every small business should track
If you’re wondering what KPIs a small business should track to measure marketing success, you’re asking exactly the right question, and most business owners ask it far too late. Many small business owners find themselves buried in data: Google Analytics, social media insights, email reports, ad dashboards. The numbers are everywhere. Yet when the one question that actually matters comes up (“is my marketing working?”), the honest answer is usually “I’m not sure.” That’s not a data problem. It’s a measurement problem.
Working with SMEs and startups across the UK, the team at UK Creative Ventures has observed a consistent pattern: businesses aren’t failing because their marketing is bad. They’re failing to measure the right things, so they can’t tell what to fix. This is an observation drawn from direct client work rather than a universal rule, but it appears with enough regularity to be worth naming.
This article gives you a short, focused list of the KPIs that connect marketing to revenue, the formulas to calculate them, realistic benchmarks for UK businesses, and the free tools to report on them every week without spending a penny.
Why most small businesses track the wrong metrics
The vanity metric trap
Vanity metrics are numbers that look good in a report but don’t connect to revenue or growth. Social media follower counts, total website traffic, and raw impression figures are classic examples. They’re easy to generate and even easier to misinterpret. A post with 5,000 impressions means nothing if nobody clicked, enquired, or bought anything as a result.
The problem isn’t that these metrics are useless in every context. It’s that they become dangerous when a business uses them as evidence that marketing is working. Follower growth doesn’t pay salaries. Impressions don’t cover rent. Only revenue does.
What a genuinely useful KPI looks like
A useful key performance indicator has three qualities: it connects directly to a business outcome, it tells you what to do when it moves, and it can be tracked consistently over time. Think of it as the difference between a north star metric (the primary measure of growth) and a diagnostic metric (the signal that tells you what’s driving or dragging the north star). Both matter, but they serve different purposes.
Small businesses do best with three to six primary KPIs rather than a sprawling dashboard. More metrics create more noise, not more insight. Start with five, measure them well, and build from there.
What KPIs should a small business track to measure marketing success?
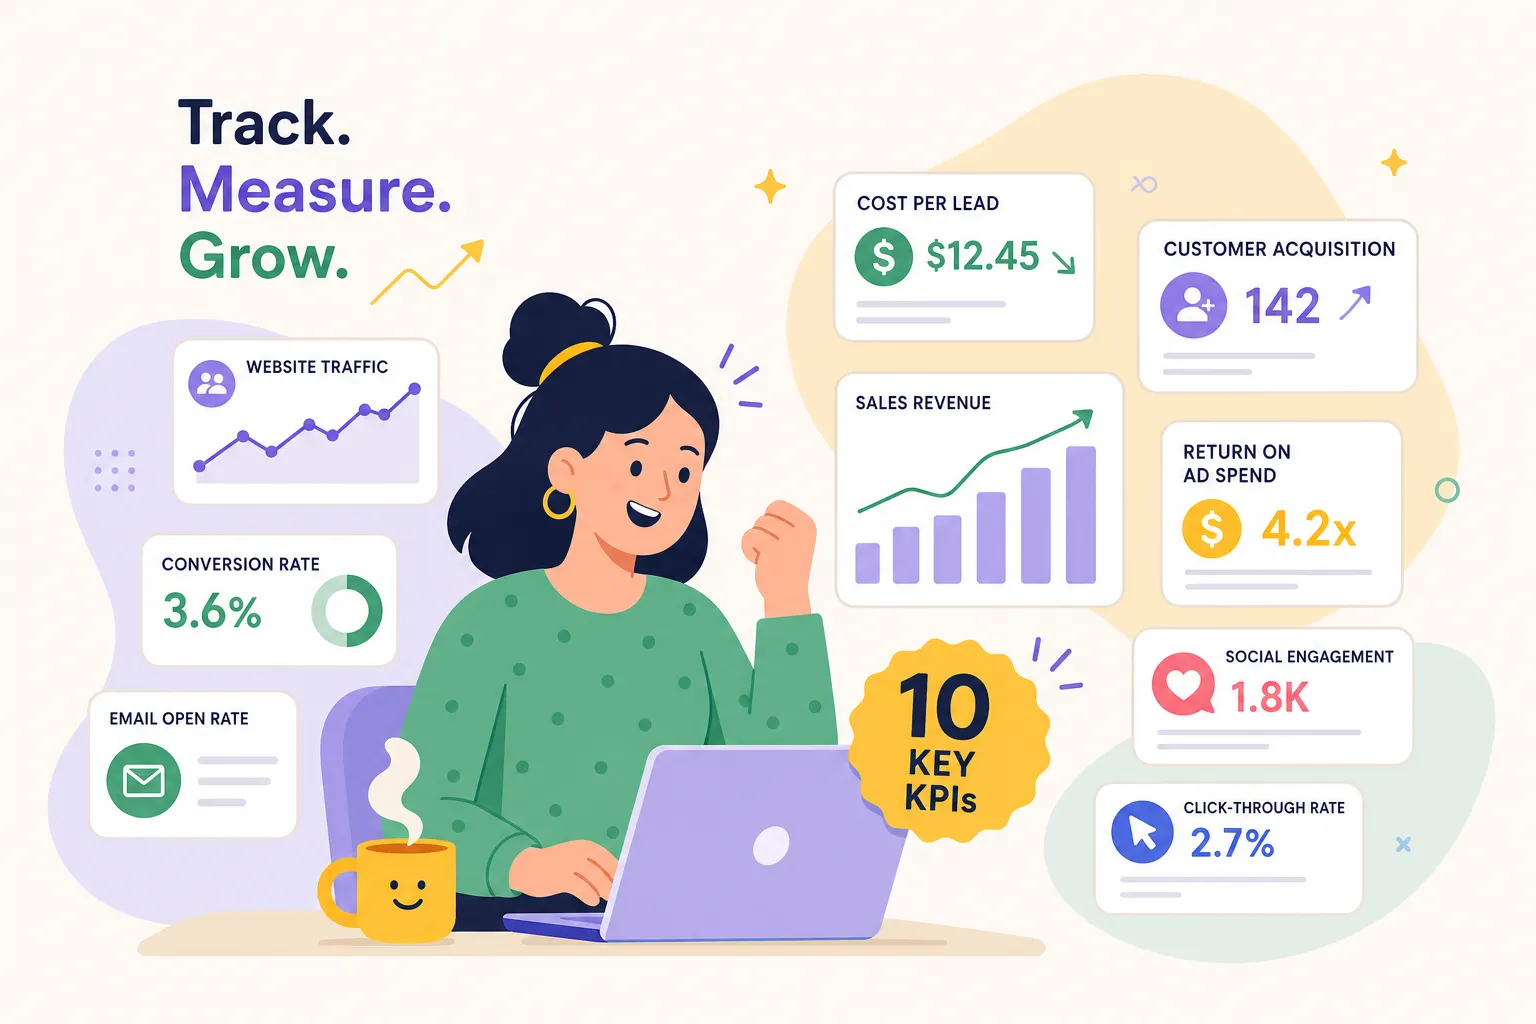
The ten KPIs below are chosen because they connect marketing activity directly to commercial outcomes. They fall into three groups: acquisition and cost, conversion and engagement, and retention and value.
Acquisition and cost metrics
Customer Acquisition Cost (CAC) tells you how much it costs to win one new customer, the clearest measure of whether growth is economically viable. Cost per Lead (CPL) is the earlier signal in the funnel; it tells you whether a campaign is generating leads at a sustainable cost before CAC starts to deteriorate. Return on Ad Spend (ROAS) gives you a fast read on paid campaigns: for every pound spent on ads, how many pounds of revenue came back? Marketing ROI is the overarching profitability measure, accounting for all marketing costs, not just media spend.
The practical difference between ROAS and marketing ROI matters for how you use them. Use ROAS to make fast, tactical decisions about which campaigns to scale or pause. Use marketing ROI when you need to evaluate whether marketing as a whole is generating profit after agency fees, tools, and staff time are included. A strong ROAS does not automatically mean a profitable campaign, because margin and overhead can quietly erode what looks like a win on the dashboard.
Conversion and engagement metrics
Conversion rate is the most direct measure of whether your marketing message is working once people arrive. If traffic is healthy but conversion rate is low, the problem usually lies in the offer, the landing page, or the audience targeting, not the volume of visitors. Lead-to-customer conversion rate matters especially for service businesses and B2B, where the journey from enquiry to signed contract can take weeks. Tracking both gives you two distinct views of the same funnel.
Click-through rate (CTR) and email open and click rates are diagnostic metrics rather than north star metrics. They tell you whether your message is resonating before someone reaches your website. Low CTR on an ad usually means the creative or copy isn’t connecting with the audience. Low email click rates often point to a mismatch between subject line promise and email content.
Retention and value metrics
Customer Lifetime Value (CLV), churn rate, and Average Order Value (AOV) are the metrics that determine whether your acquisition economics are sustainable. A business can have a well-managed CAC and still struggle if customers don’t return. For subscription-based businesses, churn is the most critical metric on the entire dashboard. For ecommerce, AOV shapes the profitability of every campaign by determining how much revenue each transaction generates relative to the cost of driving it.
These retention metrics are often the last ones small businesses start tracking, and that’s a mistake. They’re the ones most likely to reveal whether a marketing strategy is building long-term value or just creating expensive, one-time transactions.
How to calculate CAC, CLV, and conversion rate
CAC formula with a worked example
The formula is straightforward: CAC = Total sales and marketing costs ÷ Number of new customers acquired in the same period. Total costs include ad spend, agency fees, marketing software subscriptions, and any staff time directly tied to acquisition. Use a consistent time window (a month or a quarter) and count only new customers, not returning ones.
A plain example: if you spent £2,000 on marketing in a month and gained 40 new customers, your CAC is £50. Now you have a number you can work with. Is £50 sustainable given what those customers are worth over time? That’s where CLV comes in.
CLV formula and the CLV:CAC ratio
The simple CLV formula is: CLV = Average revenue per customer × Average customer lifespan. If a customer spends £80 per month and stays with you for 18 months on average, CLV is £1,440. Divide that by your CAC and you get the CLV:CAC ratio, one of the most useful health checks in marketing.
For most service businesses, a ratio of 3:1 is the minimum healthy benchmark; below 2:1, the unit economics are usually too tight to scale, and above 5:1, you may be underinvesting in acquisition and leaving growth on the table. For ecommerce businesses with tighter margins, a range of 2:1 to 3:1 is a more realistic target. The core principle holds regardless of sector: CLV must comfortably exceed CAC, with enough margin to justify the time it takes to recoup the acquisition cost.
Conversion rate and lead-to-customer rate
Website conversion rate is: conversions ÷ total visitors × 100. If 1,200 people visit your site in a month and 24 fill in a contact form, your conversion rate is 2%. Lead-to-customer conversion rate works the same way but at the next stage: divide the number of leads that became paying customers by the total number of leads. Both metrics are worth tracking, but they measure different stages of the funnel and point to different problems when they drop.
KPIs to measure marketing success: realistic targets for UK small businesses
Ecommerce conversion rate benchmarks by sector
For UK online stores, the overall market average sits around 1.9%, based on 2026 sector benchmarks from sources including IRP Commerce. What’s realistic for your business depends heavily on sector. Arts and crafts stores consistently outperform the market, averaging around 5%, while kitchen and home appliances sit near 3%. Fashion and accessories typically land around 1.5%, and food and drink can run below 1.5% in some datasets.
These figures are useful as context, not as goals. The most meaningful target is always improvement from your own baseline. If your conversion rate is 1.2% and your sector average is 1.5%, closing that gap is a far more actionable target than chasing a number borrowed from a different business with a different audience.
CAC and CPL benchmarks by channel
For UK businesses running Google Ads, CPL benchmarks vary enormously by industry. Home services typically see CPLs of around £28 to £38. B2B services and technology tend to sit between £77 and £82. Legal and finance climb above £100, sometimes significantly. These figures are drawn from 2026 UK paid search benchmark datasets and should be treated as directional rather than definitive, given the variation within each sector.
Meta Ads generally produce lower CPLs for top-of-funnel lead generation, though lead quality tends to be less predictable than from high-intent Google Search traffic, where users are actively searching for a solution.
For CAC more broadly, the honest answer is that it varies too much by industry, margin, and sales cycle to give a single reliable number. The most practical framing is this: CAC should sit well below your gross profit per customer, and you should be able to answer clearly how long it takes for a new customer to pay back their acquisition cost. Organic and referral channels tend to produce lower CAC over time than paid social or paid search, which is one reason content marketing and SEO are worth the longer investment horizon.
How to set KPI targets and build a reporting rhythm
Building a SMART KPI target
Start with the business goal, not the metric. If the goal is to generate more qualified leads, the KPI is CPL or lead volume. If the goal is to reduce wasted ad spend, ROAS is the primary measure. Once you’ve chosen the right KPI, set a baseline using current data, then assign a target that is Specific, Measurable, Achievable, Relevant, and Time-bound.
Concrete examples look like this: “Increase conversion rate from 1.8% to 2.4% by end of Q3.” Or: “Reduce cost per lead from £45 to £36 over the next six months.” Beyond the target, set an intervention threshold, the point at which a metric triggers a specific action, not just a conversation. If CPL climbs above £60 in a given week, the campaign pauses and gets reviewed. That kind of rule prevents small problems from becoming expensive ones.
Weekly, monthly, and quarterly review cadence
A practical reporting rhythm for most small businesses works across three timeframes:
- Weekly: check fast-moving campaign metrics, ad spend, CPL, CTR, and conversion rate on active campaigns. The question is simply whether campaigns are on track.
- Monthly: review the main KPI dashboard. Are the numbers moving in the right direction, and do you understand why?
- Quarterly: reset. Revisit whether the KPIs themselves still match the business goals, adjust targets based on what you’ve learned, and make any strategic changes.
Consistency matters more than perfection here. A simple review that happens every week is worth more than an elaborate dashboard that nobody opens. Build the habit before you build the system.
Free tools to build your first marketing dashboard
GA4, Search Console, and Looker Studio
Google Analytics 4 is the core free tool for tracking website traffic, engagement, and conversion-focused KPIs. Once you’ve set up key events and marked them as conversions in GA4, you can track conversion rate, traffic by channel, and campaign performance without any additional cost. Search Console fills the gap GA4 leaves around organic search: it shows which queries bring people to your site, how often your pages appear in search results, and what CTR those appearances generate.
Looker Studio connects both data sources into visual, shareable dashboards at no cost. For most small businesses, this three-tool stack covers the majority of the KPIs in this article: GA4 for on-site behaviour, Search Console for organic visibility, and Looker Studio for reporting. Set it up once, share the dashboard link with your team or clients, and it updates automatically every time you check in.
CRM tools for lead and revenue tracking
Once you need to track KPIs beyond website behaviour, specifically lead quality, pipeline value, and closed revenue, a CRM becomes important. HubSpot’s free tier is a practical starting point, offering lead tracking from first contact through to closed deal. This means you can calculate lead-to-customer conversion rate and CAC with real data rather than estimates. Other options worth considering include Zoho CRM and Pipedrive, both of which offer free or low-cost entry tiers suited to smaller teams. Connecting CRM data to GA4 or Looker Studio closes the loop between marketing activity and actual revenue, which is where the most useful insights live.
Start with five, track them well
You don’t need to measure everything. You need to measure the right things, consistently, and act on what you find. If you’re still working out what KPIs a small business should track to measure marketing success, the answer is to start with five core metrics: CAC, CPL, conversion rate, ROAS, and CLV. Calculate your current baselines, set a SMART target for each, and review them on the cadence that suits your business.
The businesses that grow well aren’t the ones with the most data. They’re the ones who’ve built a clear line between their marketing activity and their revenue, and who use that line to make faster, more confident decisions. That’s what good KPI tracking actually does.
If you’d like help building a structured marketing system with clear KPI reporting built in from the start, UK Creative Ventures works with SMEs across the UK on strategy, execution, and measurement, helping businesses move from guesswork to growth. Get in touch to find out how we can help.
Tags: