

-
2425 Views
Retention metrics are the layer most SMEs ignore entirely, often because they feel like a customer success or operations responsibility rather than a marketing one.
UKCV
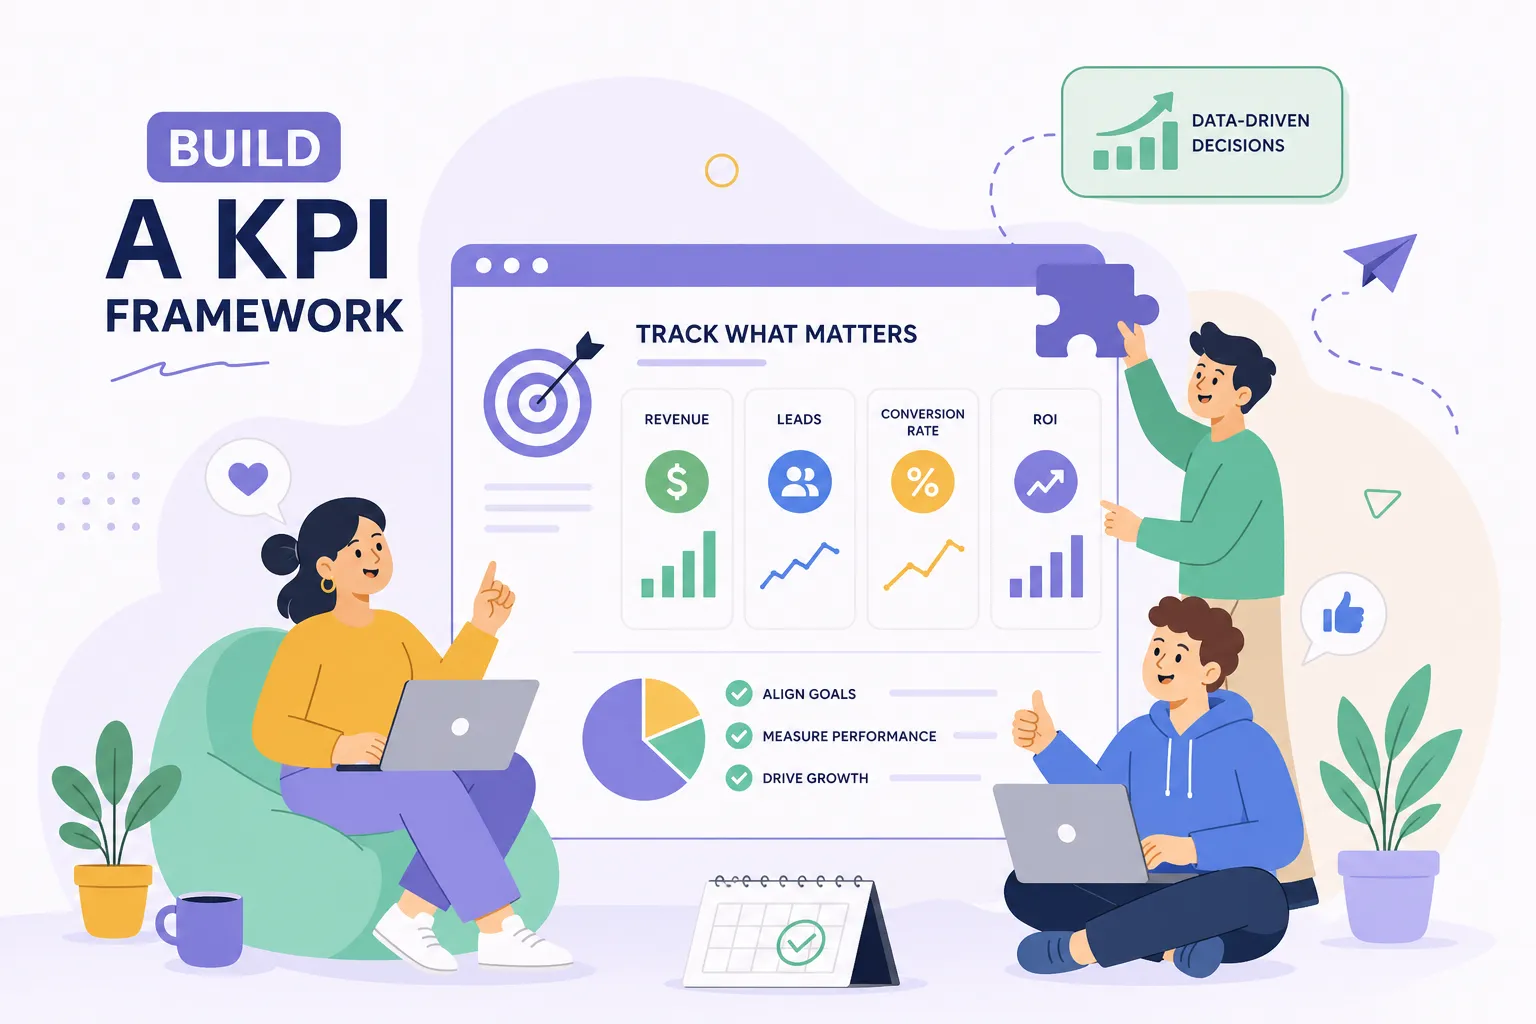
Most SMEs have more marketing data than they know what to do with. GA4 dashboards full of sessions and engagement metrics. Ad platforms reporting clicks and impressions. A CRM showing leads that nobody can quite trace back to a campaign. The problem is not a shortage of measurement tools; it is the absence of a structured approach that ties all of that activity to actual business outcomes. A solid KPI framework for marketing answers one straightforward question: is what we’re doing actually growing the business?
At UK Creative Ventures, we typically treat building this framework as the first step in every client engagement. Without it, you optimise in the dark. You spend more on what feels like it’s working and cut what you can’t prove, which often means cutting the things that matter most. This guide is not a theory exercise. It is a practical walkthrough of how to choose the right approach for your stage, select the right metrics, calculate them correctly, and report them in a way that means something to stakeholders.
Why most marketing teams are measuring the wrong things
There is a meaningful difference between activity metrics and business outcome metrics, and most SMEs default to the former because they’re easier to pull. Impressions, follower counts, page views, email open rates: these tell you what happened, not whether it mattered. They’re vanity metrics in the truest sense, not because they’re useless, but because they don’t answer the question a business owner actually cares about, which is whether the marketing spend is returning more than it costs.
Without a structured measurement framework, marketing teams tend to report good news rather than useful news. Budget conversations become guesswork. Campaigns get cut too early when they’re actually building pipeline, or run too long when they’ve stopped performing. Consider a common scenario: a business spending £3,000 per month on paid social with no visibility on cost per lead, no CRM tracking of where those leads came from, and no way to connect ad spend to sales pipeline. The team reports that reach is up 40%. The business owner doesn’t know whether to increase the budget or cancel the campaign. That’s the gap a proper KPI framework for marketing closes.
Choosing the right KPI framework for your business
There are three frameworks worth understanding honestly. OKRs (Objectives and Key Results) work well for outcome-focused team alignment on a quarterly cycle. They move teams from reporting activity to committing to measurable outcomes. The risk is that poorly written OKRs slide into task lists, and ambitious goal-setting without measurement discipline produces vanity metrics dressed up as key results. AARRR (Acquisition, Activation, Retention, Referral, Revenue) is excellent for funnel diagnosis and growth experimentation. It maps naturally to the customer journey and helps you spot exactly where your funnel is leaking. Its limitation is that it underweights brand-building, long-cycle demand effects, and strategic trade-offs outside the funnel.
The Balanced Scorecard gives the fullest picture across financial, customer, internal process, and learning dimensions. It is strong for executive reporting and connects marketing activity to commercial outcomes rather than just activity counts. The trade-off is setup time and ongoing governance; for a team of two or three people, it can become a reporting burden faster than it becomes a decision-making tool. For most UK SMEs, the most practical starting point is a lightweight OKR approach for team focus, combined with a small set of funnel metrics, a lean marketing KPI framework, that gives you diagnostic power without metric sprawl.
The North Star metric approach, where a single number reflects the core value your business delivers, is worth understanding but rarely sufficient on its own. It works best when supported by input metrics your team can influence and guardrail metrics that prevent you from optimising one number at the expense of everything else. Choose your framework based on your stage and team size, not on what sounds most sophisticated.
KPI framework for marketing: the four layers
Awareness metrics answer one question: are the right people finding us? Organic reach, share of voice, branded search volume, and paid impressions sit at this layer. The goal is not raw volume but qualified reach. These are leading indicators of pipeline health because every conversion starts with awareness. A drop here may show up in your conversion numbers after several weeks if you’re not watching, the precise lag varies by industry, channel mix, and sales cycle length.
Engagement metrics sit between awareness and conversion. Time on page, email click-to-open rate, social engagement rate, and content downloads tell you whether your messaging is resonating or simply being seen. Low engagement after strong reach commonly signals a message or targeting problem rather than a budget problem. Throwing more spend at a weak message produces more expensive indifference.
Conversion metrics are where most teams focus, often exclusively. Cost per lead, MQL-to-SQL conversion rate, landing page conversion rate, and cost per acquisition sit here. The core formula is straightforward: conversions divided by total visitors or leads, multiplied by 100. The challenge is that these figures live across multiple platforms. GA4 captures on-site behaviour, your CRM tracks lead stages, and ad platforms report spend. None of them gives you the full picture on their own, which is why attribution breaks down for so many SMEs.
Retention metrics are the layer most SMEs ignore entirely, often because they feel like a customer success or operations responsibility rather than a marketing one. Repeat purchase rate, net revenue retention, and customer lifetime value belong in your marketing KPI dashboard because they tell you whether you’re acquiring the right customers in the first place. If your retention numbers are weak, the problem often starts upstream in targeting and messaging rather than downstream in post-sale service.
SME-ready KPI examples by business model
For B2B and lead generation businesses, the priority KPI set should cover cost per lead, MQL volume, MQL-to-SQL conversion rate, cost per SQL, opportunity rate, and pipeline value. These six marketing performance indicators give a clear picture of demand generation efficiency without creating the metric sprawl that makes weekly reviews unmanageable. The most important formula to embed early is cost per SQL, a more honest measure of acquisition efficiency than cost per lead alone.
As a working benchmark: UK B2B SME MQL-to-SQL conversion rates sit around 13, 15% (based on widely cited industry benchmarks; verify against your sector and sales cycle). Anything consistently below 10% usually signals either a lead quality problem or a misalignment between how marketing defines a qualified lead and how sales uses it. Tracking this figure monthly is one of the fastest ways to surface a sales-marketing disconnect before it damages pipeline.
For e-commerce and direct-to-consumer brands, the core KPI set should include conversion rate, average order value, cost per acquisition, return on ad spend, repeat purchase rate, and customer lifetime value. ROAS alone is an insufficient measure of channel performance. A strong ROAS on a low-margin product with high return rates can destroy profitability while looking healthy in a dashboard. Pair it with average order value and LTV to get a complete picture of whether your paid channels are building a sustainable customer base or simply buying revenue. For UK e-commerce brands spending under £10,000 per month on paid media, a blended ROAS of 4x or above is a commonly cited starting benchmark, with Google Shopping and brand search typically outperforming cold social, though your target will depend on your margin structure.
For service businesses and agencies, the metrics that matter most are cost per qualified lead, proposal-to-close rate, average contract value, and client retention rate. These four marketing KPI examples reflect the longer, relationship-driven sales cycles typical of the sector and help marketing teams demonstrate commercial contribution beyond raw lead volume.
Calculating your KPIs and knowing where the data lives
Five formulas cover the majority of what a small marketing team needs to calculate and report. Customer acquisition cost is total marketing plus sales spend divided by new customers acquired. Conversion rate is conversions divided by total visitors or leads, multiplied by 100. ROAS is revenue from ads divided by ad spend. Customer lifetime value is average purchase value multiplied by purchase frequency multiplied by customer lifespan. MQL-to-SQL rate is SQLs divided by total MQLs, multiplied by 100. Each of these is a sentence your team can act on, not just a figure to report.
Most SMEs need four data sources to calculate these accurately: GA4 for web traffic, on-site behaviour, and landing page conversion data; your CRM for leads, pipeline stages, and closed-won customers; ad platforms for spend, impressions, and click data; and your billing or e-commerce platform for actual revenue and order data. The gap most businesses face is not missing tools; it is that these four sources are not connected. UTM parameters get dropped at form submission. CRM records don’t carry campaign attribution. Revenue data stays in an accounting system that nobody exports. A well-structured spreadsheet that pulls from these four sources manually is a perfectly valid reporting layer before investing in a full BI tool. The discipline of connecting the data matters more than the sophistication of how you display it.
Connecting GA4 to your CRM is simpler than most teams assume. Using Google Tag Manager to capture UTM parameters and the GA4 client ID, storing those values in hidden form fields, and mapping them into CRM fields at submission gives you the campaign attribution data you need. From there, tools like Zapier or Make can push lifecycle updates back into GA4 so closed deals can be tracked against the original marketing source.
Setting up your KPI dashboard for weekly and monthly reporting
A weekly marketing KPI dashboard should be a single page covering five to ten core metrics. Each metric should show the current value, a four-week rolling average, and a short trend line. The design principle is exception-driven: the dashboard should make it immediately obvious what is off-target, not just what happened. Add a short action tracker with owner, due date, and status for any metric in the red. Weekly reviews should be short and focused; many teams complete them within 15, 30 minutes. If reviews are consistently running longer, the dashboard is probably doing too much work.
Monthly reporting serves a different purpose. It rolls up weekly data into business outcomes and trend narratives. It should cover an executive summary of overall performance and commercial impact; three to five strategic KPIs compared to the prior month and quarter-to-date; a risks and opportunities section explaining why results changed; and a clear priority list for the following month. The monthly report answers the “so what?” question that the weekly dashboard doesn’t have time for. If your monthly report is mostly just bigger tables of the same weekly data, it is not doing its job. Stakeholders need to understand what changed, why it changed, and what you’re doing about it.
Most UK SME marketing teams review KPIs monthly, check active campaign performance weekly, and recalibrate the framework itself quarterly. That cadence works well because it separates operational decisions from strategic ones. Quarterly resets are where you ask whether you’re still tracking the right things for the current stage of the business.
Build the KPI framework first, then execute
A KPI framework for marketing is not about tracking more. It is about tracking the right things at the right layer of the funnel and connecting them to business outcomes. The four-layer model, awareness, engagement, conversion, and retention, gives you the backbone. Choosing a framework suited to your stage gives you the structure. Selecting five to eight core KPIs aligned to your business model gives you focus. And connecting your data sources gives you the accuracy to trust what the dashboard tells you.
If you are an SME owner who wants this built into your marketing from the start rather than bolted on after six months of unclear results, UK Creative Ventures integrates this measurement framework into client engagements as standard practice. The result is a marketing KPI framework that makes performance visible at every stage, so decisions are grounded in data rather than instinct. Get in touch to talk through what the right framework looks like for your business.
Tags: