Build the framework. Use it. Everything else is noise.
UKCV
Most marketing teams measure everything and understand nothing.
They track impressions, clicks, followers, engagement rates, MQLs, SQLs, pipeline value, and a dozen other metrics. Then they sit in monthly reviews unable to answer the one question leadership actually cares about: “Is marketing working?”
The problem isn’t lack of data. It’s lack of a framework.
A KPI framework is a decision-making tool that tells you which metrics actually matter, how they connect to revenue, and what action to take when they move up or down. Without one, you’re drowning in data but starving for insight.
This guide explains the KPI frameworks experienced UK CMOs use to measure marketing ROI, prove value to leadership, and make evidence-based decisions about where to invest.
Why Most Marketing Dashboards Are Useless
The typical marketing dashboard looks like this:
- – Website traffic: Up 15% this month
- – Social media followers: Up 8%
- – Email open rate: 22%
- – MQLs generated: 347
- – Pipeline influenced: £450k
- – CAC: £312
Leadership looks at this and asks: “So… is that good?”
And marketing says: “Yes, traffic is up and we generated more leads than last month.”
But no one can answer:
- – Are we on track to hit revenue targets?
- – Which channels are actually driving customers (not just leads)?
- – Should we invest more in what’s working or fix what’s broken?
- – What happens if we cut budget by 20% which metrics collapse first?
The dashboard shows activity, not outcomes. It tracks what marketing did, not what marketing achieved.
The Difference Between Metrics, KPIs, and North Star Metrics
Before building a framework, you need to understand the hierarchy:
Metrics (The Data You Track)
These are the raw numbers:
- 1. Website sessions
- 2. Email clicks
- 3. LinkedIn impressions
- 4. Form submissions
- 5. Trial sign-ups
- 6. Demo requests
Metrics are useful for diagnosing problems, but they don’t tell you if you’re succeeding.
KPIs (The Metrics That Matter)
Key Performance Indicators are the metrics that predict or measure success.
They answer: “Are we making progress toward our goals?”
Examples:
- – Customer Acquisition Cost (CAC): What does it cost to acquire a customer?
- – Customer Lifetime Value (LTV): How much is a customer worth?
- – LTV:CAC ratio: Are we acquiring customers profitably?
- – Marketing-sourced revenue: How much revenue did marketing generate?
You should have 5-10 KPIs, not 50. If everything is a KPI, nothing is.
North Star Metric (The One Thing That Matters Most)
This is the single metric that best represents whether your business is growing sustainably.
Examples:
- – SaaS company: Monthly Recurring Revenue (MRR) or Active Users
- – E-commerce: Revenue or Repeat Purchase Rate
- – Agency: Billable Hours Utilised or Client Retention Rate
The North Star Metric is what the CEO cares about. Everything marketing does should connect back to it.
What a Real Marketing Strategy Looks Like (Not Just Ads & Posts). A proper strategy defines success criteria upfront, which means choosing KPIs that connect marketing activity to business outcomes, not vanity metrics that look good in reports.
The Four KPI Frameworks UK CMOs Actually Use
Different businesses need different frameworks. Here are the four most common models:
Framework 1: The Pirate Metrics (AARRR) for SaaS and Digital Products
Best for: SaaS, apps, subscription businesses, digital products
The framework:
- 1. Acquisition: How many people are discovering us?
- Metrics: Website traffic, brand awareness, top-of-funnel leads
- 2. Activation: How many people have a positive first experience?
- Metrics: Trial sign-ups, onboarding completion rate, time to first value
- 3. Retention: How many people keep using the product?
- Metrics: Monthly active users, churn rate, product engagement
- 4. Revenue: How many people are paying?
- Metrics: MRR, ARPU (average revenue per user), upgrade rate
- 5. Referral: How many people are recommending us?
- Metrics: NPS, referral rate, viral coefficient
Why it works:
It forces you to think beyond acquisition. You can’t just focus on getting more users, you need to activate them, retain them, monetise them, and turn them into advocates.
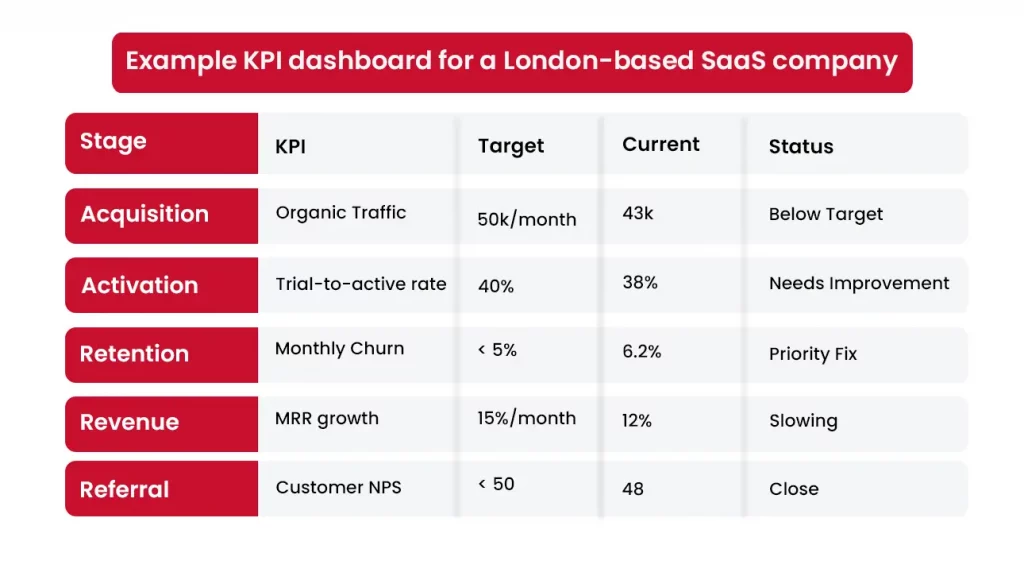
The insight: This company’s biggest problem is retention (6.2% churn). They could spend more on acquisition, but it won’t help if customers are leaving. The priority should be fixing onboarding and product engagement.
Framework 2: The Revenue Attribution Model for B2B
Best for: B2B companies with sales teams, long sales cycles, complex deals
The framework:
Track how marketing contributes to revenue at every stage of the funnel.
Key metrics:
- 1. Marketing-sourced pipeline: Opportunities that started with a marketing touchpoint
- 2. Marketing-influenced pipeline: Opportunities where marketing touched the prospect at any point
- 3. Marketing-sourced revenue: Closed deals that originated from marketing
- 4. Marketing-influenced revenue: Closed deals where marketing was involved
- 5. Pipeline velocity: How fast deals move through the funnel
- 6. Win rate by source: Percentage of opportunities that close, segmented by originating channel
Why it works:
It proves marketing’s contribution to revenue in language the CFO and CEO understand. It also reveals which channels generate the highest-quality pipeline, not just the most leads.
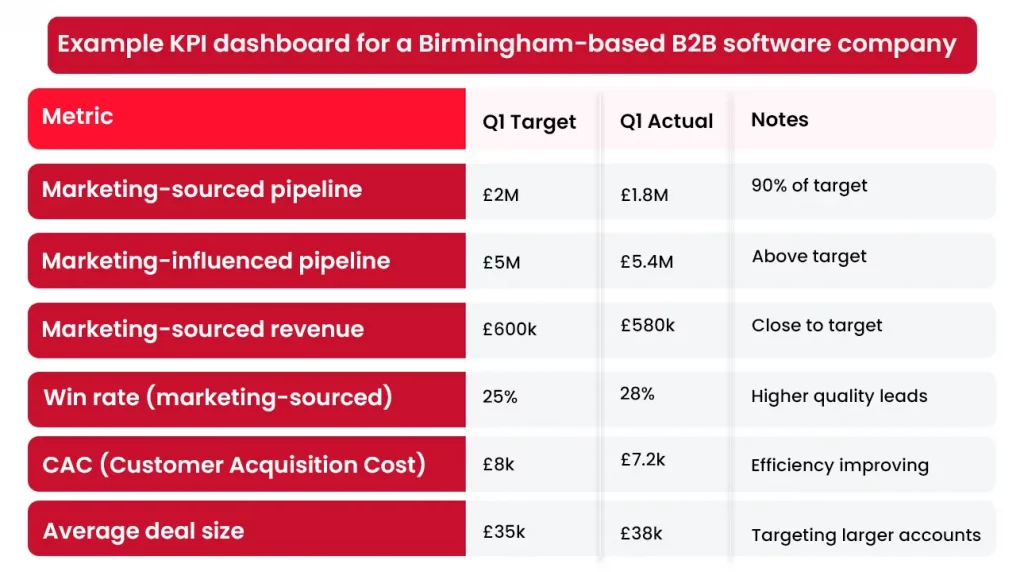
The insight: Marketing is slightly below pipeline targets but win rates are higher and CAC is lower, which means lead quality has improved. The strategy is working they just need slightly more volume.
How to Build a Full-Funnel Marketing Strategy (UK Case Examples). Attribution models only work if you have a clear funnel with defined stages and handoffs between marketing and sales, otherwise you’re measuring activity, not outcomes.
Framework 3: The Efficiency Model for SMEs and Agencies
Best for: SMEs, agencies, consultancies, professional services with limited budgets
The framework:
Focus on efficiency metrics that show you’re getting maximum return from limited resources.
Key metrics:
- 1. CAC (Customer Acquisition Cost): What does it cost to acquire a customer?
- 2. LTV (Customer Lifetime Value): How much revenue does a customer generate over their lifetime?
- 3. LTV:CAC ratio: Are we acquiring customers profitably? (Target: 3:1 or higher)
- 4. Payback period: How long to recover CAC? (Target: <12 months)
- 5. Marketing efficiency ratio: Revenue generated per £1 spent on marketing
- 6. Organic vs paid ratio: How much revenue comes from free channels vs paid?
Why it works:
When resources are constrained, you can’t waste money on channels that don’t deliver. This framework forces ruthless prioritisation of what actually drives revenue.
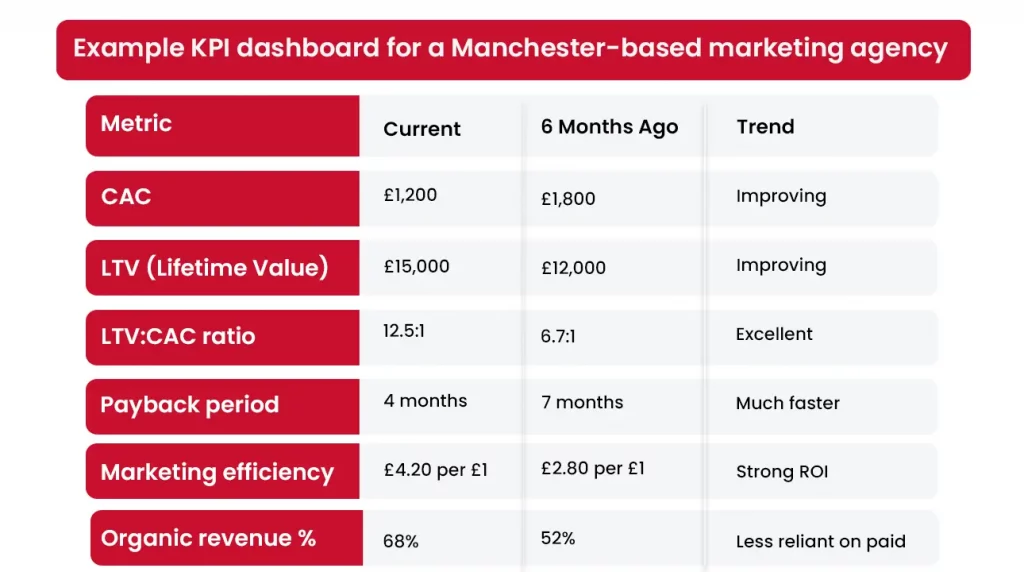
The insight: This agency has dramatically improved efficiency by focusing on retention (higher LTV) and organic channels (lower CAC). They’re acquiring customers profitably and recovering costs quickly.
Framework 4: The Brand + Performance Hybrid for Scale-Ups
Best for: Scale-ups balancing short-term revenue with long-term brand building
The framework:
Track both immediate performance metrics (growth marketing) and longer-term brand health metrics.
Performance metrics (short-term):
- – Revenue
- – CAC
- – Conversion rates
- – ROAS (Return on Ad Spend)
Brand metrics (long-term):
- – Branded search volume (how many people search for you by name)
- – Direct traffic (how many people come straight to your site)
- – Unaided brand awareness (do people know you without prompting?)
- – Share of voice (how often you’re mentioned vs competitors)
- – Sales cycle length (are deals closing faster because people know you?)
- – Win rate (are you winning more deals because of brand strength?)
Why it works:
It prevents the trap of optimising purely for short-term performance at the expense of long-term growth. Brand metrics are leading indicators, if they improve, performance metrics will follow.
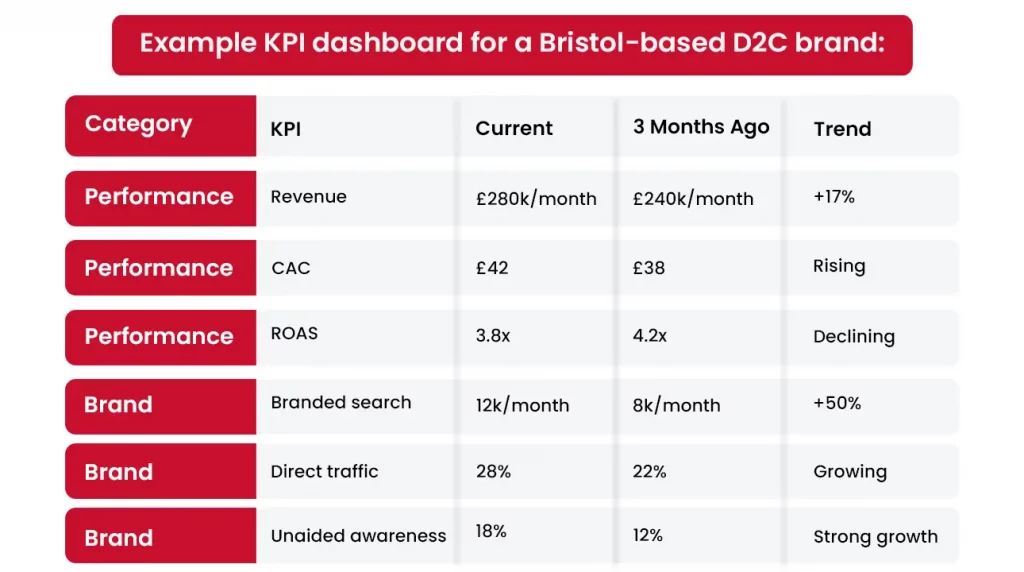
The insight: Performance metrics (CAC, ROAS) are declining slightly because competition is increasing. But brand metrics are improving rapidly, which means they’re building long-term defensibility. The strategy is working they just need to ride out the short-term efficiency decline as brand compounds.
Growth Marketing vs Brand Marketing: What UK CEOs Get Wrong. Understanding the difference between short-term performance metrics and long-term brand metrics prevents the mistake of killing initiatives that are working but haven’t paid off yet.
How to Choose the Right Framework for Your Business
The framework you choose depends on your business model, stage, and goals.
Use Pirate Metrics (AARRR) if:
- – You’re a SaaS, app, or subscription business
- – You have a self-service product (people can sign up and use it without talking to sales)
- – Retention and churn are major drivers of growth
- – You need to balance acquisition with activation and retention
Use Revenue Attribution if:
- – You’re B2B with a sales team
- – You have a long sales cycle (3+ months)
- – Multiple stakeholders are involved in decisions
- – You need to prove marketing’s contribution to pipeline and revenue
Use the Efficiency Model if:
- – You’re an SME with limited budget
- – You need to prove ROI quickly
- – You can’t afford to waste money on unproven channels
- – Leadership is skeptical about marketing value
Use the Brand + Performance Hybrid if:
- – You’re a scale-up balancing growth and brand
- – You’re investing in both short-term performance and long-term positioning
- – You need to justify brand spend to a performance-focused CEO or CFO
- – You’re in a competitive market where brand is a moat
Marketing Strategy for UK Businesses in 2026. Choosing the right measurement framework is part of your overall marketing strategy, it needs to align with your business model, goals, and the way your leadership team evaluates success.
How to Build Your KPI Dashboard (Step-by-Step)
Here’s the practical process for building a KPI framework that actually gets used:
Step 1: Define Your North Star Metric
What is the single metric that best represents business health?
For most businesses, it’s some version of revenue:
- 1. SaaS: MRR (Monthly Recurring Revenue) or ARR (Annual Recurring Revenue)
- 2. E-commerce: Revenue or Gross Profit
- 3. Agency: Retained Client Revenue or Billable Utilisation
- 4. Marketplace: GMV (Gross Merchandise Value) or Active Users
Everything else should connect back to this.
Step 2: Identify 5-7 Supporting KPIs
These are the metrics that drive your North Star Metric.
If your North Star is MRR, your supporting KPIs might be:
- – New customer acquisition
- – Churn rate
- – Expansion revenue (upsells)
- – Average contract value
If your North Star is revenue, your supporting KPIs might be:
- – Traffic
- – Conversion rate
- – Average order value
- – Repeat purchase rate
Don’t pick more than 7. If you have 20 KPIs, you don’t have priorities.
Step 3: Set Targets for Each KPI
For each KPI, define:
- – Baseline: Where are we now?
- – Target: Where do we need to be in 6 months? 12 months?
- – Acceptable range: What’s the threshold where we’d consider it “good enough”?
Targets should be ambitious but realistic. If you’ve never hit £100k MRR, don’t set a target of £500k in 6 months.
Step 4: Assign Ownership
Every KPI should have an owner, someone who’s responsible for moving it.
Example:
- – CAC: Performance marketing manager
- – Conversion rate: Head of growth or CRO specialist
- – Churn rate: Customer success manager
- – MRR: CMO (overall accountability)
Ownership creates accountability. If a KPI is declining, there’s a specific person responsible for fixing it.
Step 5: Build the Dashboard
You don’t need expensive BI tools. A Google Sheet or simple dashboard in your analytics platform is often enough.
What to include:
- – Current value
- – Target value
- – Previous period comparison (month-over-month or year-over-year)
- – Trend indicator (✅ improving, ⚠️ flat, ❌ declining)
- – Owner
Update it monthly. Review it in leadership meetings.
Step 6: Review and Iterate Quarterly
Every quarter, ask:
- – Are we tracking the right KPIs?
- – Are targets still realistic?
- – Have business priorities changed?
- – Do we need to add or remove metrics?
KPI frameworks aren’t static. As your business evolves, your metrics should too.
UK Case Example: FinTech Scale-Up (B2B SaaS)
Company: Edinburgh-based expense management software for SMEs
The problem:
They were tracking 30+ metrics in their monthly reports. Leadership meetings turned into debates about which numbers mattered. No one could agree on whether marketing was working.
What they did:
They implemented a simplified KPI framework based on the Revenue Attribution model.
Their North Star Metric:
- – ARR (Annual Recurring Revenue)
Their 6 Supporting KPIs:
- – Marketing-sourced pipeline (£ value of opportunities originated by marketing)
- – Marketing-influenced pipeline (£ value of opportunities touched by marketing)
- – Win rate (% of opportunities that close)
- – CAC (Customer Acquisition Cost)
- – Payback period (months to recover CAC)
- Net Revenue Retention (existing customer expansion – churn)
How they tracked it:
Built a simple dashboard in Google Sheets, updated weekly by the marketing ops manager, reviewed monthly in leadership meetings.
What changed:
Before the framework:
- – Debates about vanity metrics (traffic, MQLs, impressions)
- – No consensus on what “success” meant
- – Budget allocated based on gut feel
- – Marketing felt defensive in leadership meetings
After the framework:
- – Clear, objective view of marketing’s contribution
- – Leadership understood that marketing-sourced pipeline was 42% of total (not 15% like they assumed)
- – Budget decisions became evidence-based (doubled down on SEO and content, cut event spend by 60%)
- – Marketing team could confidently say “we’re on track” or “we need to adjust”
Results after 12 months:
- – Marketing-sourced pipeline increased from £1.2M to £2.8M per quarter
- – Win rate improved from 18% to 24% (better lead quality)
- – CAC decreased from £9,200 to £6,800 (more efficient channels)
- – Payback period shortened from 14 months to 9 months
- – ARR grew 68% year-over-year
The key insight: They were already doing good work. The framework just made it visible and measurable, which gave leadership confidence to invest more.
Common Mistakes When Building KPI Frameworks
Mistake 1: Tracking Too Many Metrics
If your dashboard has 25 KPIs, you don’t have a framework, you have a data dump.
The fix: Ruthlessly cut to 5-10 metrics that actually matter. Everything else is context, not a KPI.
Mistake 2: Measuring Activity Instead of Outcomes
“Number of blog posts published” is not a KPI. “Organic traffic from blog content” might be.
“Emails sent” is not a KPI. “Revenue generated from email campaigns” is.
The fix: Every KPI should connect to a business outcome (revenue, customers, retention). If it doesn’t, it’s not a KPI.
Mistake 3: No Targets or Benchmarks
Saying “CAC is £450” is meaningless without context. Is that good? Bad? Improving?
The fix: Set targets and track trends. “CAC is £450, down from £520 last quarter, target is £400 by Q3” is useful.
Mistake 4: Ignoring Leading Indicators
Revenue is a lagging indicator by the time it moves, the work that drove it happened months ago.
Leading indicators (pipeline, trial sign-ups, branded search) tell you what’s coming before it shows up in revenue.
The fix: Balance lagging indicators (revenue, customers) with leading indicators (pipeline, traffic, engagement).
Mistake 5: Building a Dashboard No One Looks At
If your dashboard lives in a BI tool that requires 6 clicks to access, no one will use it.
The fix: Make it visible. Share it in Slack weekly. Include it in every leadership deck. Make it impossible to ignore.
Why Most UK Businesses Waste 40% of Their Marketing Budget. One of the biggest sources of waste is continuing to fund tactics that don’t move KPIs. A proper measurement framework makes waste visible and therefore fixable.
How to Prove Marketing ROI to Skeptical Leadership
Even with a solid KPI framework, you’ll face questions like:
“Can you prove marketing caused that revenue?”
“How do we know these leads wouldn’t have come in anyway?”
“What’s the actual return on investment?”
Here’s how to answer:
1. Use Marketing Mix Modelling (For Larger Budgets)
If you’re spending £500k+ annually, statistical models can isolate marketing’s impact by comparing periods with different spend levels.
Example: Revenue increased 15% in Q2. We increased marketing spend by 20% in Q1. Controlling for seasonality and other factors, we estimate marketing contributed 8-12 percentage points of that growth.
This isn’t perfect, but it’s more rigorous than gut feel.
2. Run Holdout Tests
Stop marketing to a segment of your audience and measure what happens.
Example: A Manchester-based retailer stopped all paid ads to customers in the North West for 4 weeks. Revenue from that region dropped 18% compared to other regions. When ads resumed, revenue recovered.
Conclusion: Paid ads were driving 18% of revenue in that market.
3. Track Incrementality, Not Just Attribution
Attribution asks: “Which touchpoint caused the conversion?”
Incrementality asks: “Would this conversion have happened without marketing?”
Example: 40% of your customers search for your brand name and convert. Attribution says “organic search drives 40% of revenue.” Incrementality asks: “Would they have found us without our brand campaigns?”
Incrementality is harder to measure but more honest.
4. Use Proxy Metrics
If you can’t measure direct ROI, measure proxies:
- – Branded search volume: If more people are searching for you by name, awareness is working
- – Direct traffic: If more people come straight to your site, brand recall is improving
- – Sales cycle length: If deals close faster, marketing is pre-qualifying prospects
- – Win rate: If you’re winning more deals, brand strength is improving
If these improve and revenue improves, there’s a correlation (even if you can’t prove causation).
5. Be Honest About What You Can’t Measure
Don’t claim perfect attribution if it doesn’t exist.
Instead, say: “We can’t track every touchpoint, but here’s what we know: branded search is up 40%, sales cycles have shortened by 3 weeks, and win rates have improved from 15% to 22%. We’re confident marketing is contributing, even if we can’t quantify it perfectly.”
Leadership respects honesty more than fake precision.
Final Thought
You don’t need a perfect KPI framework. You need one that’s good enough to make decisions.
Most marketing teams spend weeks debating which metrics to track and which attribution model to use. Meanwhile, they’re flying blind because they’re tracking nothing consistently.
Pick a framework. Implement it. Measure consistently for at least two quarters. Adjust as you learn.
The businesses that win aren’t the ones with the most sophisticated dashboards. They’re the ones that know which 5-7 metrics matter, track them relentlessly, and act on what the data tells them.
Build the framework. Use it. Everything else is noise.
Marketing Strategy for UK Businesses in 2026 A KPI framework is the measurement component of your complete marketing strategy it closes the loop between planning, execution, and accountability, ensuring that strategy translates into measurable results.